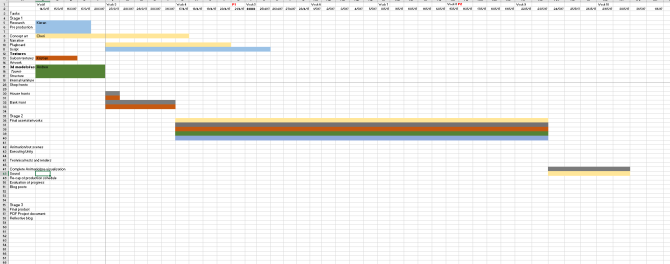

The Gantt chart shows what we as individuals within our team had to complete to meet certain deadlines which our group leader (Kieron Lowe) had set. Unfortunately due to the fact that I can’t expand the picture of the Gantt chart anymore It’s hard to read because WordPress doesn’t allow me to show a bigger picture of this image. Though the Gantt chart is unreadable it is essentially showing what my role was and what assets I had to complete by a certain date, so that I could move onto the next task.
My job role was to 3-D model some basic assets used within the game and other job was which was my hardest was the UV mapping for the majority of the assets within the whole game.
I feel as if we failed to meet deadlines that our leader had set quite a lot of the time because our group struggled with UV mapping. However I found out an easier technique which helped me fix the broken UV’s of the objects that my team mates had created and even helped me to fix the UV’s of my own creations. When UV mapping cylindrical objects like barrels, wagon wheels and bottles I used cylindrical mapping and when I was trying to UV map more simple shapes such as squares and rectangles I used planar mapping. By learning these techniques I was able to get the UV mapping done a lot quicker although I realized that even on my own it wasn’t going to be completed.
So I taught the rest of my group how to use planar and cylindrical mapping meaning we were able to UV map our own objects as a team rather than one person (myself) having to UV map most of the assets which made the process faster and in the end we were able to complete everything we needed for the final deadline.